Your first API integration with Streamlit and Plotly: How to Create Interactive Web Apps as a Data Scientist
We need APIs in modern applications all the time. This article shows how to use the World Air Quality API to create a simple Streamlit app.
We need APIs in modern applications all the time. Be it to display weather data, use the Google or GitHub login, process online payments with Stripe or PayPal or integrate social media posts into external tools. They allow us to connect different services without having to redevelop the underlying technology.
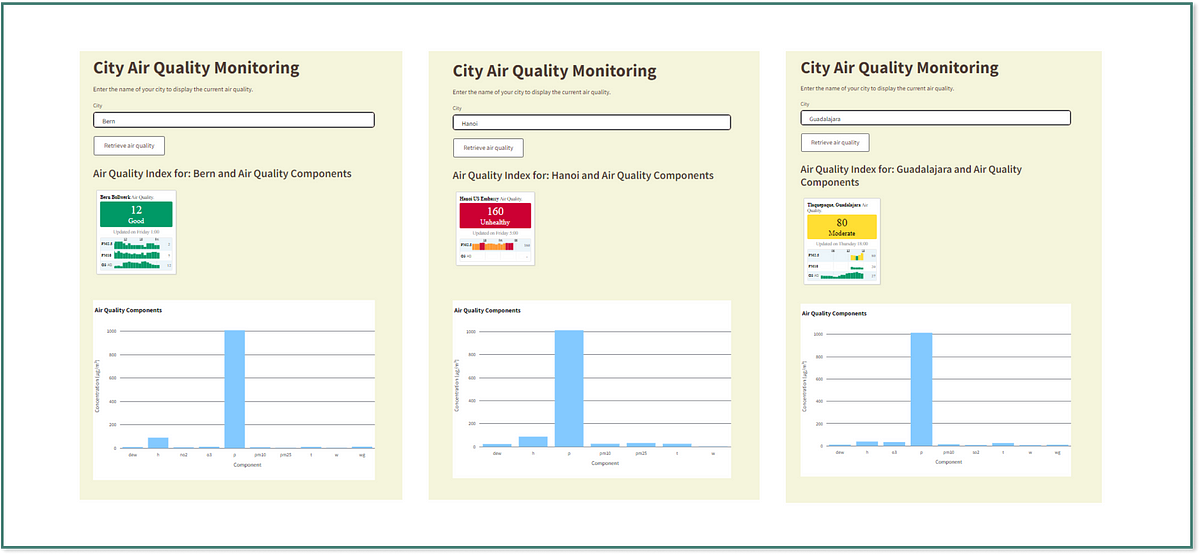
But how exactly does an API work? If you’re a newbie to this topic, the best way to understand how it works is to try integrating an API (Application Programming Interface) into an app yourself. If you are already familiar with APIs, it will be interesting for you to see how you can use an API in a Streamlit application. In this article, I’ll show you how to use the World Air Quality API to create a simple Streamlit app that retrieves and visualizes air quality data from different cities worldwide.
If you have never worked with Streamlit before, you can read one of my recent articles Streamlit 101 — Create a simple Data Visualization App in 20 Minutes with Python Streamlit to understand the basics. Streamlit is an open-source framework that allows you to quickly and easily create interactive web apps for data science and machine learning applications.
Other free APIs that you can use instead of the Air Quality API are:
OpenWeatherMap API — Create an app that shows you data on temperature, humidity and weather conditions.
News API — Create an app that retrieves the latest news and add a filter to filter by topic or source.
AlphaVantage API — Build an app that visualizes current stock prices of various companies and the price trend.
I decided to use the World Air Quality API. This API provides air quality data such as PM2.5, PM10, CO2 and the Air Quality Index of cities worldwide.
How a Rest API works
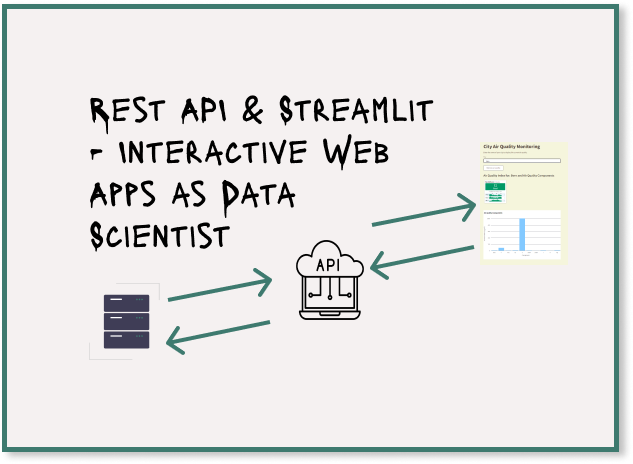
The World Air Quality is a REST API (Representational State Transfer). It is the most widely used architecture for APIs. If you are a newbie, it is certainly good if you understand this concept and know how to integrate an API. REST APIs allow applications to communicate with each other via the HTTP protocol. There are also other API types such as SOAP (based on a more formal, standardized protocol and uses XML) or GraphQL (works more flexibly by allowing the client to request exactly the data that is needed).
To help you understand how an API works, there are 2 metaphors that are often used:
Imagine an API like a situation in a restaurant: You as a customer (= user) order a dish (= a request).
The waiter (= the API) passes on your order (= your request) to the kitchen (= the server). The kitchen (= the server) prepares the dish (= the data) and returns it to the waiter (= the API), who brings the plate (= your request) back to you.Imagine an API like the situation when you are traveling abroad and need to charge your cell phone: Your devices have a certain plug (= your app), but the power socket in the foreign country has a different connection (= the server). This is where the adapter (= the API) comes into play. The adapter (= the API) ensures that your device (= your app) receives the energy (= your requested data) from the socket (= the server) in the right way.
In the World Air Quality API, the app sends a request (air quality data for a specific city). The server checks the request using the API key, retrieves the requested data and sends it back.
In our app, this is a relatively simple implementation. In more complex cases, an API request could include multiple parameters (e.g. date filters, user locations, real-time data, etc.). Such queries could require much larger amounts of data or dynamic data, which is then processed by the API and returned to the app.
Step-by-step guide integrating an API (Application Programming Interface) into your Streamlit app
1. Registration and API key of Air Quality API
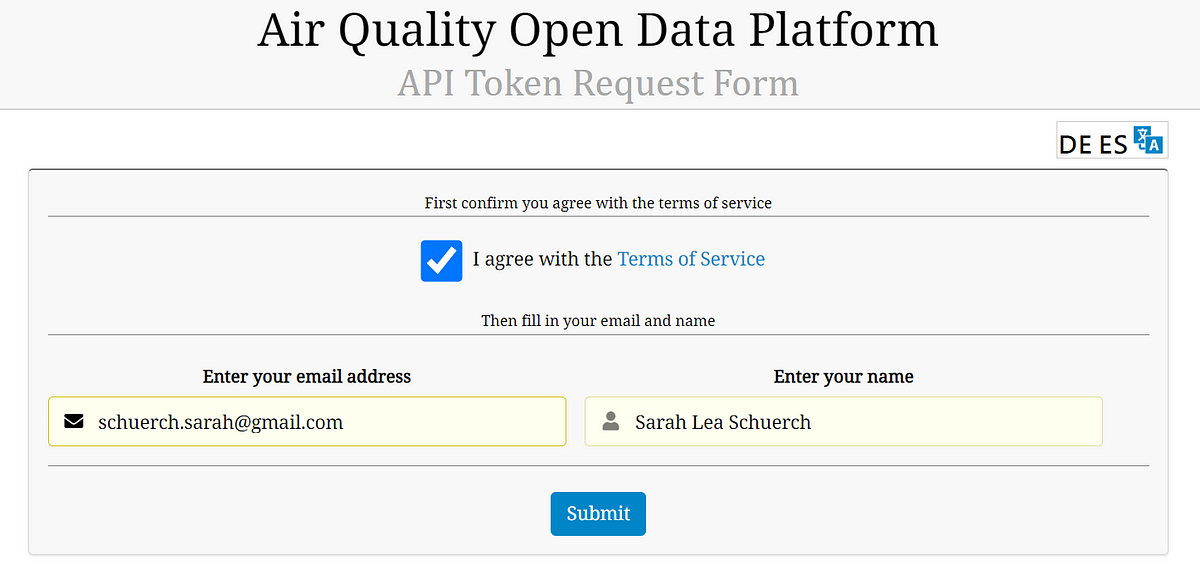
In the first step, you need an API key. This key is a unique code that is used to access the API. This enables the API provider to identify requests and ensure that only authorized users have access to the API. The provider can also track the number of requests and thus prevent the API from becoming overloaded. Without a valid key, your app will not have access to the desired data.
It is important that you never share your API key publicly (treat it more like a password). To access the World Air Quality API, you must register and then you get your API key.
2. Set up the environment
Next, create your Python environment in which you want to create your Streamlit app. If you don’t know why it is important to set up a specific Python environment, you can read the basics in this article Python Data Analysis Ecosystem — A Beginner’s Roadmap.
Use the command below to create a new environment in Windows and Anaconda Prompt.
You can then activate the environment and install the packages you need for this Streamlit app, which integrates an API. You need the Streamlit package to develop the web application. It is a framework that has been specially developed for data science and machine learning and allows you to create applications directly from a Python script. You need the requests-package to retrieve data from external APIs. It is used to send HTTP requests to the Air Quality API and process the responses. You have probably already come across the plotly package. We use this to create interactive diagrams. Alternatively, you could also use matplotlib, for example, but the diagrams are not interactive.
3. Creating the app
The first step is to import all the required packages. In addition to the 3 packages mentioned above, we import the ‘components.v1’ package from Streamlit so that we can integrate custom HTML, CSS and JavaScritp elements into the app. We need this package so that we can display the Air Quality widget (see below) directly in the app.
We then define the style for the app in the CSS block. ‘st.markdown’ is a function in Streamlit for embedding Markdown syntax and HTML in the app. With this command, we can embed formatted text such as HTML or CSS code into the app. In this case, we have used ‘unsafe_allow_html=True’ because the st.markdown() function requires this parameter as soon as HTML code is included. However, you should only use ‘unsafe_allow_html=True’ if you are sure that no unsafe content will be embedded, as it opens up potential security gaps for cross-site scripting. Alternatives would otherwise be functions built into Streamlit such as ‘st.header()’ or ‘st.button()’.
import streamlit as st
import requests
import plotly.express as px
import streamlit.components.v1 as components

# CSS to customize the background and text colors
st.markdown("""
    <style>
    /* Background color of the app */
    .stApp {
        background-color: #f5f5dc;
    }

    /* Header colors (h1, h2, etc.) */
    h1, h2, h3, h4, h5, h6 {
        color: #4b3832;
    }

    /* Default text colors (for p, label, button, text input) */
    p, label, .stButton, .stTextInput {
        color: #3e2723;
    }

    /* Button style */
    div.stButton > button {
        background-color: white;
        color: black;
        border: 2px solid #666666;
        padding: 10px 24px;
        font-size: 16px;
        cursor: pointer;
        border-radius: 4px;
    }

    /* Style for the input field (outer div) */
    div[data-baseweb="input"] > div {
        background-color: white;
        color: black;
        border: 2px solid #666666;
        padding: 10px;
        font-size: 16px;
        border-radius: 4px;
    }

    /* Style for the input field itself */
    input {
        background-color: white;
        color: black;
        border: none;  /* No inner border */
        outline: none; /* No focus outline */
    }
    </style>
    """, unsafe_allow_html=True)
4. Integrating the API key & defining the air quality retrieving function
In the next step, we integrate the API key from step 1 to enable the app to access the data from the World Air Quality API. This key authenticates the request by signaling to the server that the sender is authorized to access the requested data. The app sends an HTTP request to the API server, which checks the validity of the API key. If the key is correct, the server responds with the requested air quality data and sends it back to the app.
It is important that you never disclose the API key in publicly accessible code, as it could be used to make unauthorized requests. A secure method is to store the API key in environment variables or use a configuration file (e.g. `.env` file) that is not shared with the source code in public repositories. Or you can manage the API key in cloud services such as Streamlit Secrets, AWS Secrets Manager or Azure Key Vault. This ensures that only authorized users can access the key.
You can find more information and detailed instructions on the secure handling of API keys in my article Streamlit and GPT-4: Is Building a Simple Chatbot Really that Easy?.
We then create a function that retrieves the air quality data for a specific city from the API. With ‘requests.get(url) we send a request to the API. The response is then processed in JSON format and if the status is “ok”, the data is returned. If the status is not “ok”, an error is displayed in the app.
If you do not yet have the app ready, you can also make a simple data query to the API by entering this URL in your browser: http://api.waqi.info/feed/shanghai/?token=Your_API_Key
Replace `Your_API_Key` with your own API key. You will then receive the air quality data for the city of Shanghai as a response in JSON format.
# World Air Quality API key (replace with your own key)
api_key = 'Your Key'

# Function to retrieve air quality data from the API
def get_air_quality(city):
    # Construct the API request URL using the city and API key
    url = f'http://api.waqi.info/feed/{city}/?token={api_key}'
    response = requests.get(url)  # Send the request

    # Process the API response and convert it to JSON format
    data = response.json()

    # Check if the request was successful (status: 'ok')
    if data['status'] == 'ok':
        return data['data']  # Return the air quality data if available
    else:
        st.error(f"Error when retrieving air quality data: {data['data']}")
        return None  # Return None if there's an error
5. Visualizing the air quality components
With this code, we create a function that takes the air quality components (e.g. PM2.5, CO, NO2) and creates a bar chart with Plotly. The chart is then displayed in Streamlit using ‘st.plotly_chart()’. The If condition checks whether air quality components are available. If no data is available, the else condition is executed.
# Function for visualizing the air quality components using Plotly
def visualize_air_quality(components):
    # Check if the air quality components are available
    if components:
        labels = list(components.keys())  # Extract component names
        values = list(components.values())  # Extract corresponding values

        # Create a bar chart using Plotly
        fig = px.bar(x=labels, y=values, labels={'x':'Components', 'y':'Concentration (μg/m³)'})

        # Update the layout with customized style
        fig.update_layout(
            title=dict(text="Air Quality Components", font=dict(color="black")),  # Title in black
            xaxis_title="Component",  # X-axis label
            yaxis_title="Concentration (μg/m³)",  # Y-axis label
            plot_bgcolor="#fff",  # White background for the plot area
            paper_bgcolor="#fff",  # White background for the entire chart
            font=dict(color="black"),  # Font color for labels and titles
            xaxis=dict(title_font=dict(size=14, color="black"), tickfont=dict(color="black")),  # Black X-axis labels
            yaxis=dict(title_font=dict(size=14, color="black"), tickfont=dict(color="black"))   # Black Y-axis labels
        )

        # Display the Plotly chart in Streamlit
        st.plotly_chart(fig)
    else:
st.write("No air quality components available.") # Handle if no data is present6. Defining the layout of the app
In this section, we define the layout of the app, which has a very simple structure. With ‘st.title()’ we output a header, with ‘st.write()’ a text and with ‘st.text_input’ an input field in which the user can enter the name of a city.
# Streamlit App Layout
st.title("City Air Quality Monitoring")  # App title
st.write("Enter the name of your city to display the current air quality.")  # Instructions for the user

# User input for the city name
city = st.text_input("City", "Enter the name of your City (e.g. Shanghai)")
7. Triggering the API call and AQI-Widget
As soon as the user clicks on the “Retrieve air quality” button, the ‘get_air_quality()’ function defined above is called. This will retrieve the air quality data of the selected city and if data is returned, the air quality index will be displayed.
We then embed the Air Quality Index widget for the selected city.
By inserting HTML and JavaScript, the widget is displayed in the app. With `components.html()` the widget is rendered in the Streamlit app.
In the last code section, we check whether the air quality components are present. If so, they are extracted and passed to the ‘visualize_air_quality()’ function to display them as a chart. If no data is available, the corresponding message is output.
# Button to trigger the API call and display the results
if st.button("Retrieve air quality"):
    # Get air quality data for the entered city
    air_quality_data = get_air_quality(city)

    # Check if data was successfully retrieved
    if air_quality_data:
        aqi = air_quality_data['aqi']  # Get the Air Quality Index (AQI)
        st.subheader(f"Air Quality Index for: {city} and Air Quality Components")  # Display AQI

        # Define the Air Quality Index widget HTML inside the if block
        widget_html = f"""
        <div style="width: 300px; height: 200px;">
        <script type="text/javascript" charset="utf-8">
          (function (w, d, t, f) {{
            w[f] = w[f] || function (c, k, n) {{
              s = w[f], k = s['k'] = (s['k'] || (k ? ('&k=' + k) : ''));
              s['c'] = c = (c instanceof Array) ? c : [c];
              s['n'] = n = n || 0;
              L = d.createElement(t), e = d.getElementsByTagName(t)[0];
              L.async = 1; L.src = '//feed.aqicn.org/feed/' + (c[n].city) + '/' + (c[n].lang || '') + '/feed.v1.js?n=' + n + k;
              e.parentNode.insertBefore(L, e);
            }};
          }})(window, document, 'script', '_aqiFeed');
        </script>

        <span id="city-aqi-container"></span>
        <script type="text/javascript" charset="utf-8">
          _aqiFeed({{
            container: "city-aqi-container",
            city: "{city.lower()}",
            display: "%details"  # Display detailed AQI info
          }});
        </script>
        </div>
        """

        # Display the Air Quality Index widget for the selected city
        components.html(widget_html, height=260)

        # Check if air quality components (like PM2.5, CO2, etc.) are available
        if 'iaqi' in air_quality_data:
            # Extract the components and their concentrations
            components_data = {key: value['v'] for key, value in air_quality_data['iaqi'].items()}
            # Visualize the air quality components using a bar chart
            visualize_air_quality(components_data)
        else:
            st.write("No air quality components available.")  # If no components are available
8. Running the app
As soon as you have navigated to the directory in the terminal where your air_quality_dashboard.py file is stored, you can start the app with ‘streamlit run air_quality_dashboard.py’. The app will then open automatically in your browser.

Possibilities to extend your app
You could integrate a map that displays the air quality index for the city directly on the map. You can use the Map tile API from World Air Quality for this. In some cities (e.g. Mexico City or New York) the API does not show all data. For these cases, you could add error handling. Another cool feature would be that the user can enter 2 cities at the same time, from which he wants to display a comparison. Another option would be to display suggestions for improvement for the city in question, depending on how high (= poor air quality) the Air Quality Index is, or to give residents tips on how they can influence the air quality or protect themselves.
Where is the best place to continue learning?
Introduction to APIs in Python — DataCamp Course (the first part is free, no affiliate link)
API for dummies: learning the basics of API — ScrapingBee article
What is an API (application programming interface)? — IBM article
What is an API? — Red Hat article
GraphQL vs. Rest — IBM Technology YouTube Video
What Is REST API? Examples And How To Use It: Crash Course System Design — ByteByteGo YouTube Video
Final Thoughts
This Streamlit app is a fairly simple example of how to integrate an API. However, the application shows the basic principles very well and it will be much easier for you to understand APIs by integrating them into an application yourself. You bring external data into an app and then visualize it. In real applications, however, APIs can be even more complex, with apps processing real-time data, large amounts of data or dynamic data, for example.


